Two fascinating projects in signal processing: extracting a clean ECG signal from noisy data and creating a speech synthesis system using all-pole modeling. Both projects demonstrate the power of digital signal processing techniques in solving real-world problems.
Project 1: ECG Signal Extraction
Setup
A signal was supplied that closely mimicked an ECG signal with powerline noise included. The assumption was that this was 60 Hz noise. Three filters were to be designed to reduce the noise and extract a classic, made-for-TV style ECG signal. The final task was to determine the average heart rate and heart rate variability.
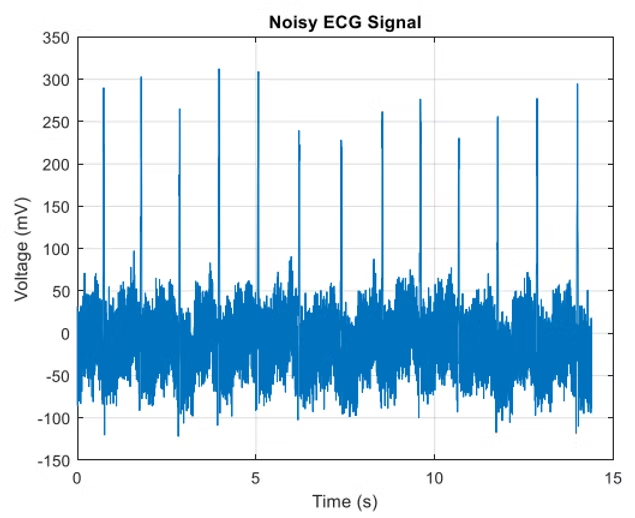
The original signal with 60 Hz powerline interference
Methodology
Upon first glance, the real signal was clearly visible beneath the noise. The magnitude spectrum confirmed the 60 Hz interference assumption:
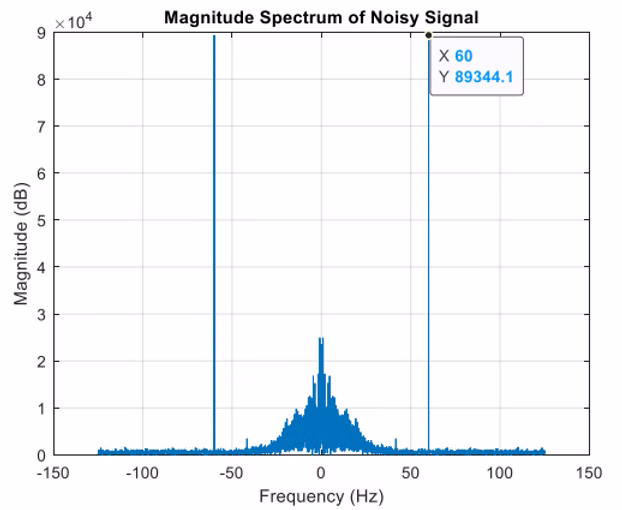
Magnitude spectrum revealing the 60 Hz powerline interference
To eliminate the powerline interference, a second order IIR notch filter was designed. A k-factor was required to maintain unity gain at zero Hz:

K-factor calculation for maintaining proper gain characteristics
Applying the notch filter to the original signal significantly improved the signal quality:
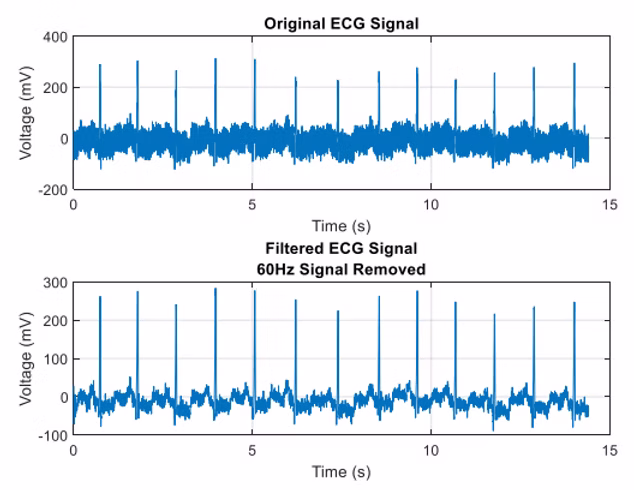
ECG signal after notch filtering - the game is afoot!
Next, a Chebyshev II Lowpass Filter was designed and applied to the notch-filtered signal:
Chebyshev II Lowpass Filter Parameters:
- Passband Ripple: 6 dB
- Stopband Attenuation: 50 dB
- Passband Edge Frequency: 50 Hz / 0.40 (Normalized)
- Stopband Edge Frequency: 60 Hz / 0.48 (Normalized)
- Filter Order: 8
Experimenting with the parameters revealed important tradeoffs - as ripple increased, roll-off worsened given the same stopband attenuation and edge frequencies. To preserve the steepest roll-off with the smallest filter order, the passband ripple was kept at 6 dB.
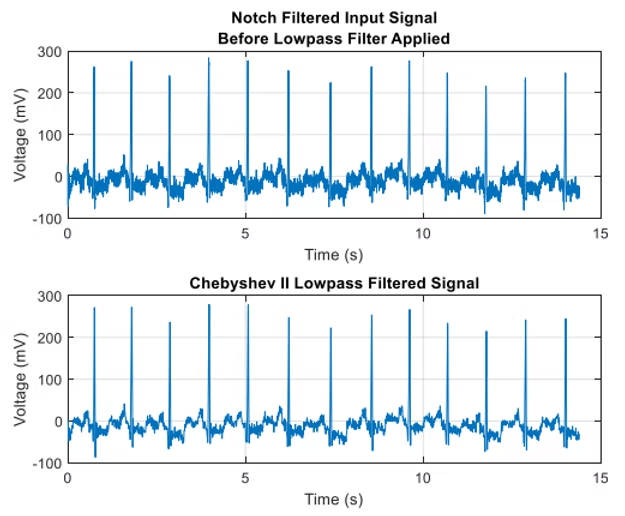
ECG signal after applying the Chebyshev II lowpass filter
The final step addressed DC signal and low frequency baseline wander using a Chebyshev II High Pass filter:
Chebyshev II High Pass Filter Parameters:
- Passband Ripple: 5 dB
- Stopband Attenuation: 50 dB
- Passband Edge Frequency: 0.8 Hz (Normalized)
- Stopband Edge Frequency: 0.7 Hz (Normalized)
- Filter Order: 8
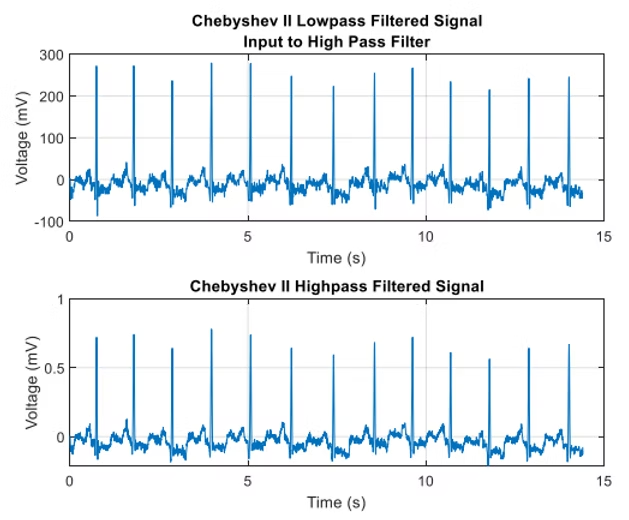
ECG signal after applying the high pass filter
Results
The filtering stages produced a signal close to the goal, with distinctive PQRST peaks and valleys visible. While technically meeting the requirements, further optimization was pursued. By adjusting parameters and using MATLAB's 'filtfilt' command instead of 'filter', the frequency-dependent delay was eliminated, producing a much cleaner result:
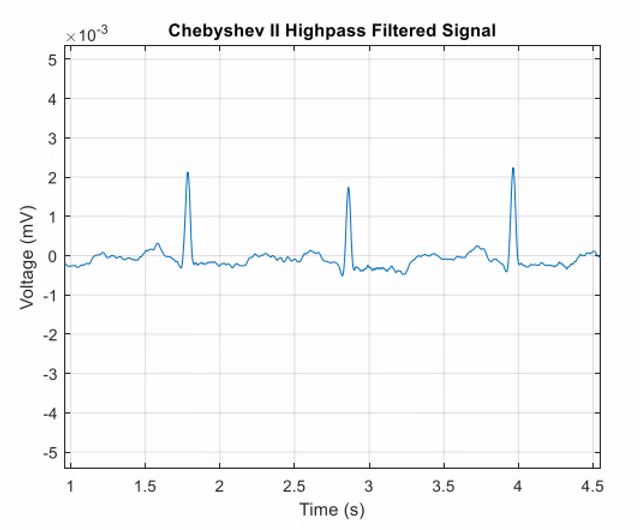
Final optimized ECG signal - much closer to the TV-quality ECG we were aiming for
While not entirely practical due to the delay removal (delays are real and necessary with IIR filters), this approach achieved the desired visual result much closer to what one would see on medical television shows.
Heart Rate Analysis Results
Using proximity-adjusted peak detection on the filtered signal:
Heart Rate: 66.3 BPM
Heart Rate Variability: 1562.5 ms (1105.6 ms RMS)
These values indicate a person age 30 or greater in relatively good health.

Proximity-adjusted peaks used for heart rate and variability calculations
Project 2: Speech Synthesis
Setup
The speech synthesis project required creating an all-pole model of a speech signal. A speech signal was analyzed and represented by all-pole filter parameters, which were then used to synthesize the original speech. The test phrase was "The empty flask stood on a tin tray."
Methodology
Key assumptions included treating short speech segments as wide-sense-stationary processes. "Voiced" and "Unvoiced" sounds were determined using a threshold of 20% of the maximum autocorrelation value.
The audio signal was sampled at 8000 Hz. Through trial and error, a segment from 1700:1900 was identified as a vowel sound (the "e" from the second word). The autocorrelation of this segment revealed the pitch at 51 samples:
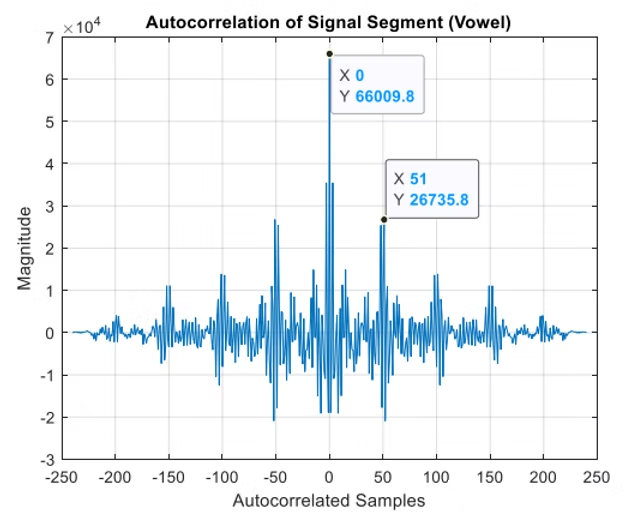
Autocorrelation of the vowel segment showing clear pitch periodicity at 51 samples
A custom pitch detection function was developed that included a 10th order FIR filter, DC removal, center clipping (75% threshold), autocorrelation analysis, and strategic peak selection to eliminate duplicates and zeros.
The 10th order all-pole model for the vowel segment took the following form:
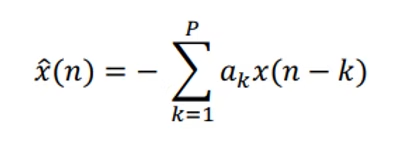
Mathematical representation of the 10th order all-pole model
Comparing the power spectral density of the actual vowel segment with the 10th order all-pole model showed that the model was an excellent estimator, particularly for periodic sections:
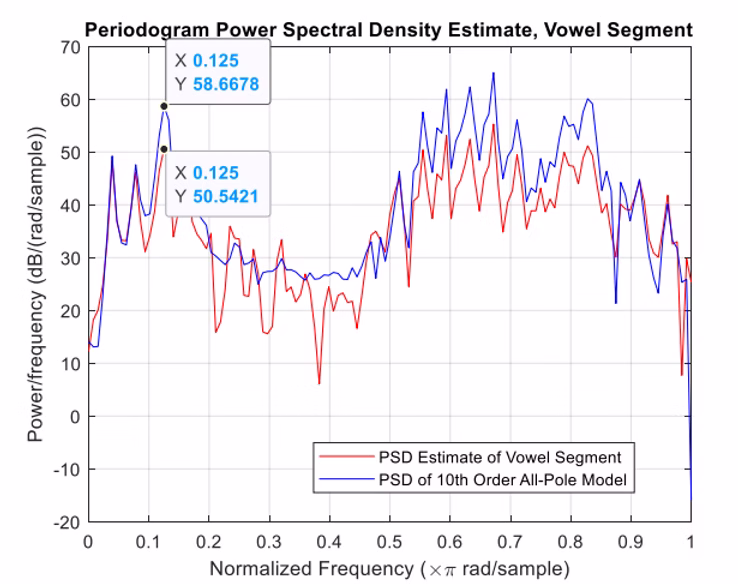
Power spectral density comparison showing excellent model performance
The analysis function segmented the entire signal into chunks with 15 ms overlaps. Each segment was windowed with a Hamming window and had its 10th order all-pole model created, including pitch and voiced/unvoiced determination. Extensive testing was required to optimize the minimum peak distance parameter.
Results
Synthesis Success!
The synthesis function combined normalized impulse trains (for voiced sounds) or white noise (for unvoiced sounds) with the coefficients to recreate the speech. The original phrase was distinctly audible in the synthesized version!
Audio files available in original project
Filter order proved critical - startup transients were noticeable when segments weren't processed in the correct order. A better approach would eliminate the playback loop and process segments serially with proper state management.
An additional experiment with "Cepstral Domain Pitch Detection" was also successful, producing a more robotic but distinctly cooler-sounding result. The delay was intentionally left unoptimized because of the interesting acoustic effect it created.
Audio Results
Listen to the original speech signal and compare it with the synthesized versions:
Original Speech
The original recording: "The empty flask stood on a tin tray."
Synthesized Audio Signal
Speech reconstructed using the 10th order all-pole model
Cepstral Method
Alternative synthesis using cepstral domain pitch detection - more robotic but distinctly cool!
Lessons Learned
These signal processing projects demonstrated the power of digital filtering and mathematical modeling in extracting meaningful information from noisy signals and recreating human speech. The ECG project highlighted the importance of proper filter design and the tradeoffs between different filtering approaches, while the speech synthesis project showcased how complex human speech can be decomposed and reconstructed using relatively simple mathematical models.
The intersection of mathematics, engineering, and human physiology creates fascinating challenges that have real-world applications in medical devices and communication systems. These projects provided hands-on experience with the theoretical concepts that power modern signal processing applications.