Having a strong background in statistics and stochastic processes, applying machine learning concepts through Python programming was an awesome challenge. This project showcases the tools, methods, algorithms, and processes for predicting tsunami wave conditions to help communities prepare for catastrophic events.
Project Setup
Problem Statement
When a catastrophic event such as a volcano eruption or an earthquake occurs, extreme wave conditions generated by the event can cause millions of dollars in damage, devastating environmental impact, and even loss of life. Early and accurate prediction of wave conditions at the point of impact could reduce the effects of such events and even help save lives.
Machine Learning Problem
Given a catastrophic event that generates extreme wave conditions, predict wave conditions at impacted areas. These areas could include coastlines, islands, and other geographical features where loss occurs.
Approach: Use buoy and meteorological datasets (NDBC, CDIP, and MSW) to create a regression model for estimating wave conditions in various locations.
Evaluation: Predicting wave conditions in tsunami risk zones could help communities avoid financial loss and enable life-saving evacuation efforts.
Primary Challenge
Adequately narrowing the scope of the project to make it manageable while maintaining real-world applicability.
Secondary Challenges:
• Determining which features to use from complex geological and oceanographic data
• Incorporating time/spatial information and correlation between measurements
• Overcoming geographical/geological constraints (underwater volcanoes, shorelines, islands)
Data Exploration and Feature Engineering
Initial Data Assessment
Reading the dataset into Python revealed considerable missing data, but the dataset contained good filters to identify event validity (e.g., "definite tsunami" vs "erroneous entry"). The data included various measurement methods for run-up height, which were normalized to align with total wave height measurements.
Data Quality
Missing target variable data: 2,183 rows out of 25,051 total (8.7%)
This aligns well with industry standards for acceptable missing data levels.
Preference was given to objectively measured data categorized as "definite tsunami" events. A correlation heatmap was generated to understand variable relationships and reduce the feature set accordingly.
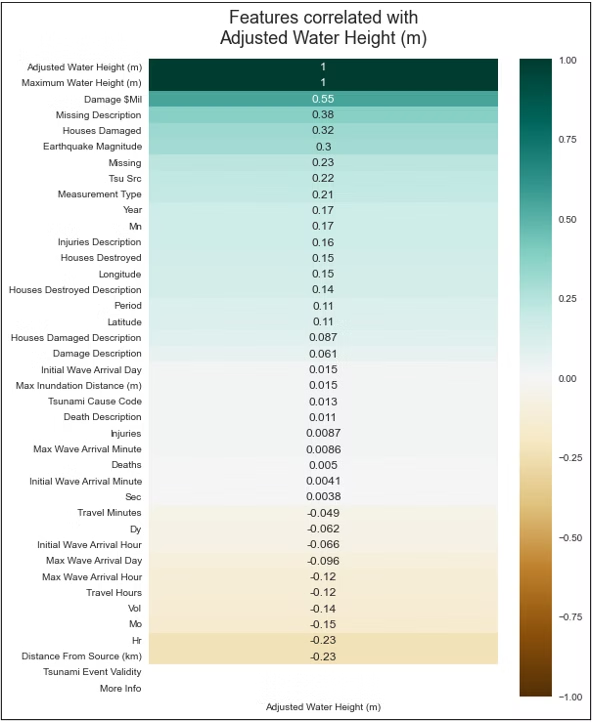
Initial correlation heatmap showing 45 total features and their relationship to the target variable
Features that were results of a tsunami (rather than causes) were eliminated (16 total), along with features having excessive missing data or redundancy (16 more), resulting in a much cleaner correlation structure:
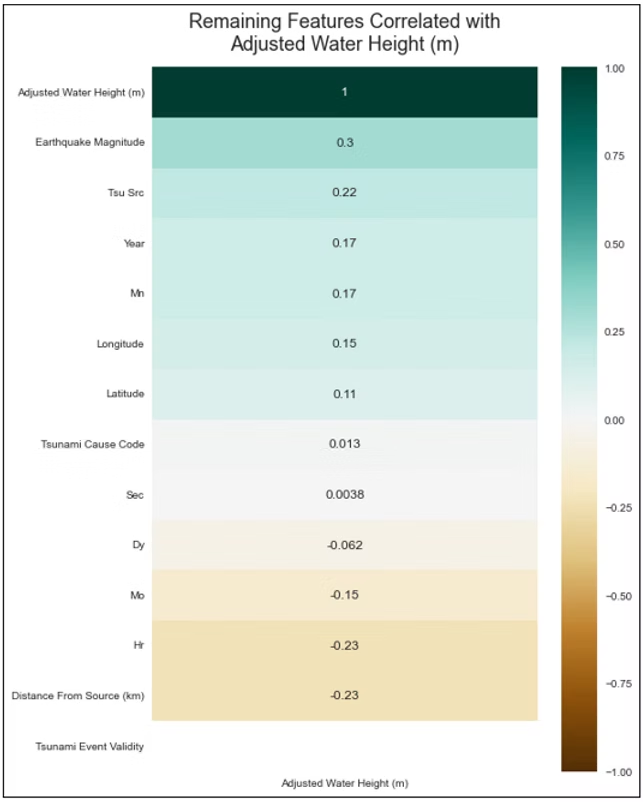
Cleaned correlation heatmap after feature elimination - trends are emerging clearly
Key Insights from Feature Analysis
Both high and low correlated features proved important. Earthquake magnitude and distance from earthquake emerged as major factors, while geographical location showed less global impact. Some years proved more prolific than others for tsunami events.
Side note: We were warned about going down the rabbit hole during feature engineering. I learned extensively about subduction-induced earthquakes and discovered why oval-shaped earthquake propagation patterns cause more damage than circular patterns, given the same magnitude, location, and distance from run-up. The physics behind wave sustainability over distance was particularly fascinating.
After addressing scaling issues (RobustScaler proved essential), temporal data leakage concerns, and duplicate detection, the feature set was reduced to its most predictive elements:
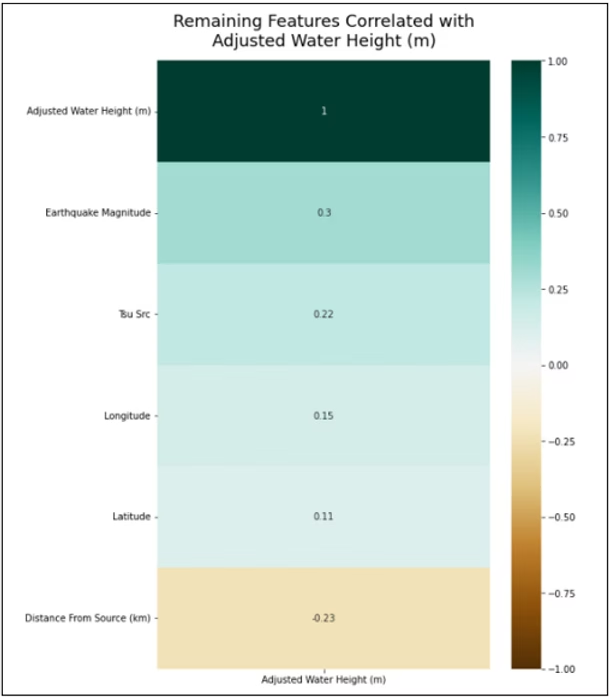
Final feature set - from nearly 50 features down to 6 essential predictors
InterpretML confirmed the top contributors to tsunami run-up prediction:
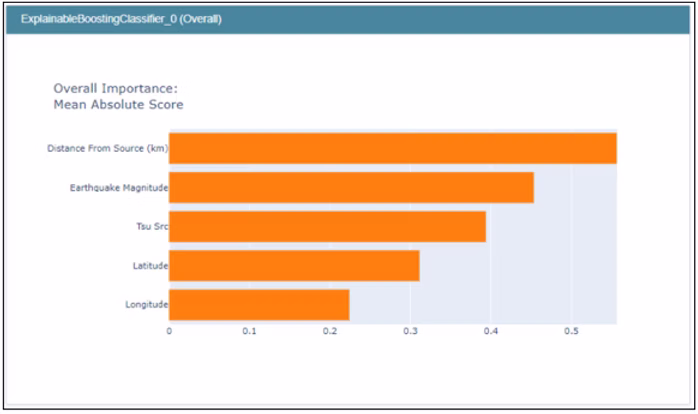
Feature importance analysis showing the most critical predictive factors
Natural Feature Splits Discovered
Distance From Source: Natural split at 300 km (nearly 50/50 distribution)
Earthquake Magnitude: Three natural groups - below 8.0, 8.0-9.0, and above 9.0
Model Performance and Results
Baseline Model Comparison
Six baseline models were established to evaluate scaling and determine optimal approaches: Linear Regression, Bayesian Ridge, Lasso CV, ElasticNet CV, SVR (RBF), and SVR (5th degree polynomial).
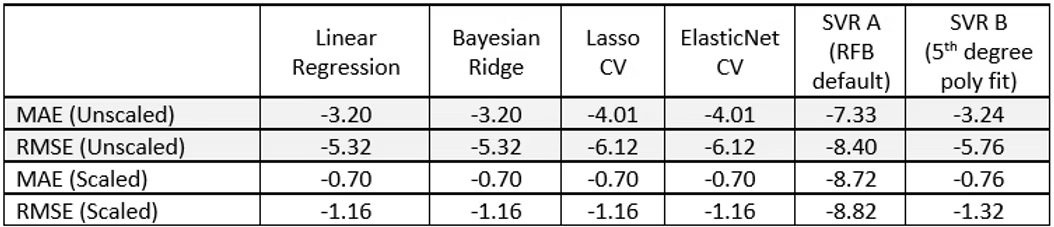
Baseline model performance - demonstrating the critical importance of proper scaling
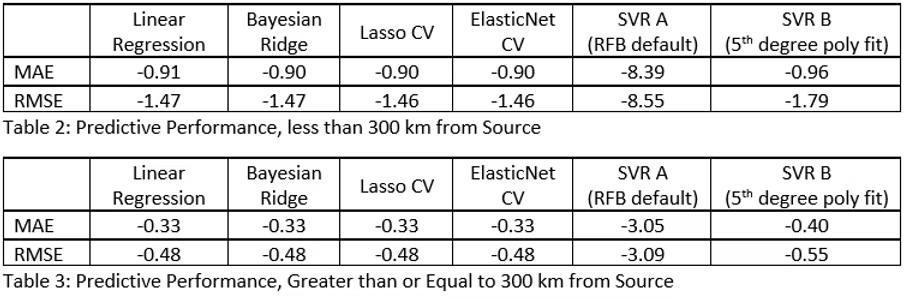
The baseline results highlighted minimal differences between the first four models. However, applying the discovered feature splits revealed significant improvements, particularly for the 300 km distance threshold and magnitude groupings:
Model Performance by Distance Threshold
Model Performance by Magnitude Groups
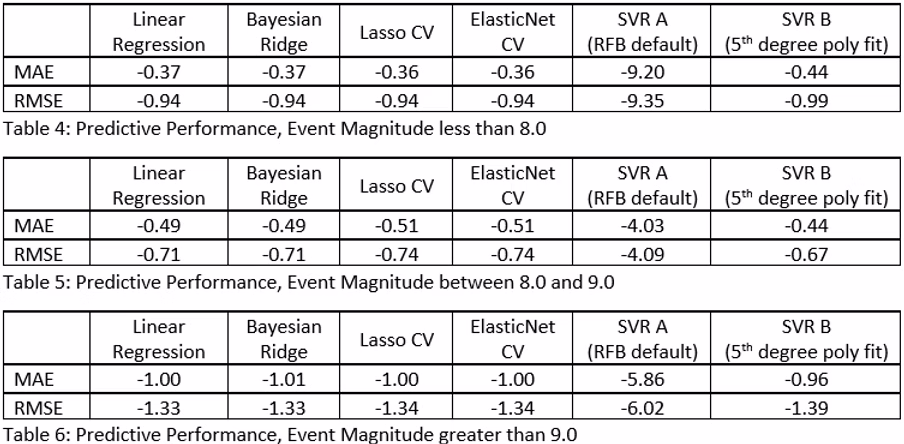
The results show dramatic accuracy improvements when diving deeper into the two most correlated features. The physical explanations for these variations align with tsunami propagation physics and seismic energy distribution patterns.
Advanced Model Performance
PyCaret Results
After Feature Engineering:
Light Gradient Boosting Machine: MAE = -0.41, RMSE = -0.91
Raw Dataset (Before Engineering):
Bayesian Ridge Regression: MAE = -0.092, RMSE = -0.241
These results align well with industry standards for tsunami run-up prediction!
The obvious advantage of using PyCaret immediately is impressive results, but the path to achieving those results can be difficult to understand and explain - a critical consideration for disaster prediction systems.
Industry Comparison
Comparing the Light Gradient Boosting Machine results to industry standard tsunami run-up predictions, our MAE and RMSE align well with similar research efforts. The combination of these predictive elements with real-time seafloor measurements could provide optimal outcomes for avoiding loss of life and resources.
Project Impact and Learning
This project was terrific on several fronts. Learning to dive deeply into data, understand underlying patterns, and extract actionable insights represents core aspects of effective machine learning. The results achieved were remarkably close to other industry standard modeling efforts, which was both validating and exciting.
The project perfectly bridged my statistical background with practical Python implementation, while addressing a real-world problem that could literally save lives. Understanding the geophysical processes behind tsunami generation and propagation added depth that pure data analysis alone couldn't provide.
Key Achievements
• Successfully reduced feature space from 45 to 6 critical predictors
• Achieved industry-competitive prediction accuracy
• Discovered meaningful natural splits in key variables
• Demonstrated the critical importance of proper data scaling
• Connected machine learning techniques to real disaster prevention
Future Directions
Further exploratory work could include applying neural networks or other advanced modeling techniques for potentially better results. Integration with real-time seismic and oceanographic monitoring systems could create operational early warning capabilities.
Repository Access
The complete project, including all code, data processing pipelines, and detailed analysis, can be found at: https://github.com/mkrohn5051/WaveRunup.git
This work demonstrates how statistical knowledge, combined with modern machine learning tools and domain expertise, can address critical societal challenges. The potential for this type of analysis to contribute to disaster risk reduction makes it particularly meaningful beyond its technical achievements.